How Knowledge Graphs can help analysing risk and resilience in cities

Our world is increasingly becoming urbanized. Today, more than half of the global population lives in cities and this trend is expected keep growing. With an increased concentration of people and infrastructure in small areas, the potential for disaster losses and impact also increases.
People living in informal settlements are particularly affected by the impacts from climate change and environmental disasters. They live in the most vulnerable places within cities, typically in areas are prone to landslides, sea-level rise, flooding, and other hazards. Preparing the cities to be able to respond effectively to shocks and stresses is essential for city planners.
The dynamics of urban shocks and stresses on the city are complex and hard to predict: they have dependencies and secondary effects. Shocks are sudden occurrences such as earthquakes or floods. On the other hand, stresses are long term conditions such as water scarcity, hot weather or the pressures caused by urbanization. How can cities be better prepared to handle such occurrences?

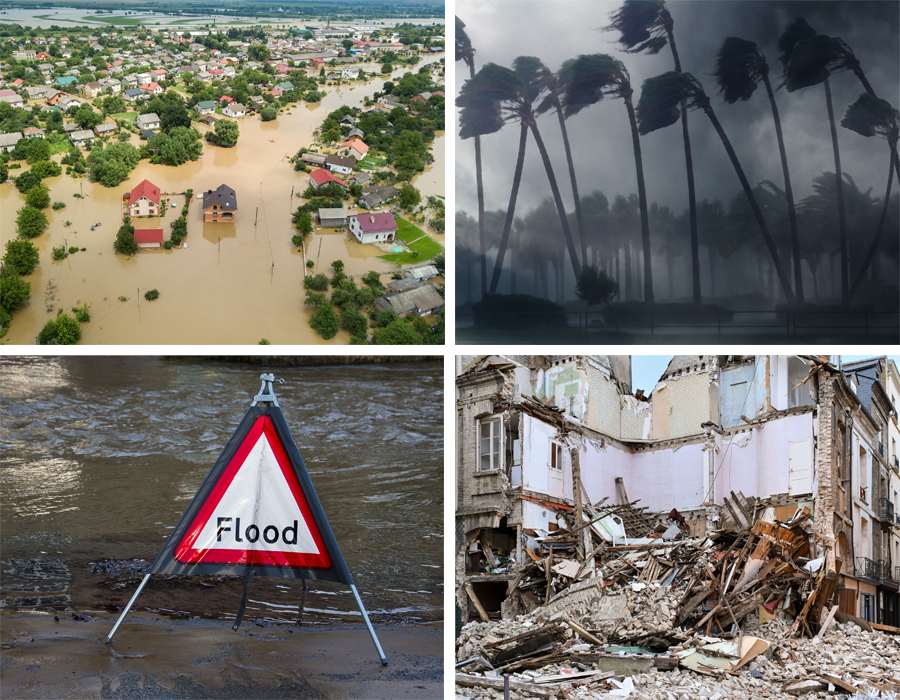
Floods and earthquakes are some of the shocks that cities are exposed to.
Using Knowledge Graphs for City Planning
Relational Knowledge Graphs are database structures that excel at mapping relationships and connections. They can perform probabilistic reasoning — that is, compute the chance of future events. Using Knowledge Graphs for analysing city shocks and stresses, may help us to determine risks and vulnerabilities in a city and give us a practical tool to develop strategies to mitigate the risks.
A knowledge graph is a model of a particular domain - a collection of interlinked descriptions of concepts, entities, relationships and events. It is a type of database where the connections and dynamics between elements are as important as the entities themselves. Importantly, a knowledge graph can contain elements of different types (say, people and roads and weather patterns and governmental policies) and allows flexible relations among these elements. The knowledge stored inside these graphs enables reasoning – for instance, analyzing the causes of an event or simulating the effects of potential interventions (actions).

Diagram from the City Resilience Profiling Tool Guide
The City Resilience Tool
Using historical data from the city of Teresina, Brazil and Amman, Jordan, our team created an ontology of floods in cities. This is an abstract model of the elements and dynamics involved in floods. The model, as well as the data, was imported into a knowledge graph and then the system was tested by asking a series of questions on the economic impact of floods. For instance, how many working days have been lost to floods? The model also allows us to find secondary effects of floods or other shocks. Using this tool we were able to determine the effect of various interventions that make the city more resilient.
How can this tool benefit urban planning?
This methodology and model offer many potential benefits to urban planners. It includes the possibility of:
- Analyzing data beyond the first order impacts of shocks (cascading effects).
- Analyzing the combined effect of shocks and stresses.
- Analyzing the impact of interventions in specific indicators to offer protection against other shocks.
- Adding other elements such as plans, policies and stakeholders, to the model and analyzing these in relation to shocks and stresses.
The City Resilience Tool demonstrates the usefulness of relational knowledge graphs to analyze shocks and stresses in a city. It allows for various types of analysis that could not easily be done otherwise. While this case focuses on floods, the principles would be the same for other types of events. Other data elements (plans, policies, stakeholders) could also be modelled in the same way. This tool could also be used more broadly by city planners with enhancements such as a no-code user interface.
Getting Started
If you want to use similar techniques to build a tool for city planners or others to increase city resilience, you can start with the following:
- Study the documentation of the models available here
- Download the model (ORM format)
- Download the notebooks. You will need to adapt them to your knowledge graph platform. If you have access to the RelationalAI platform (a free account is available), you can use them right away.
- Adapt the model to your own needs or priorities.
In case of questions contact: unitac@un.org


